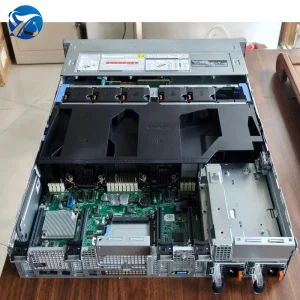
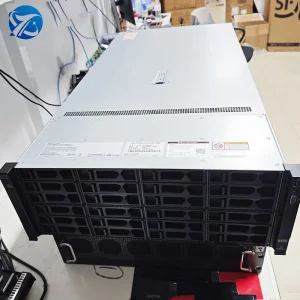
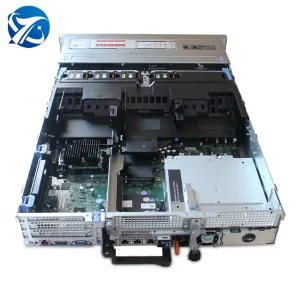
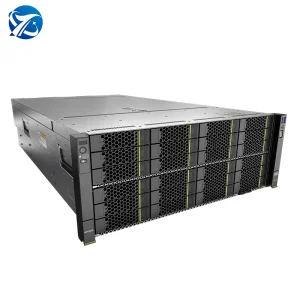
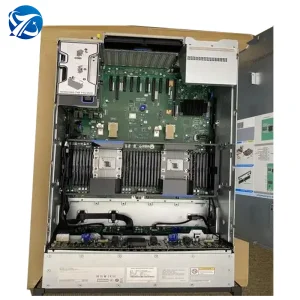
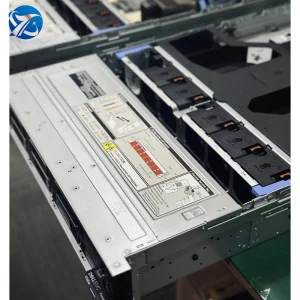
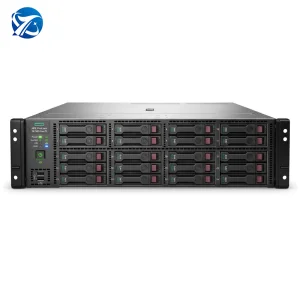
High-density computing arrays featuring integrated Out-Of-Band (OOB) hardware telemetry controllers, real-time power capping interfaces, and enterprise IPMI 2.0 / Redfish specifications.
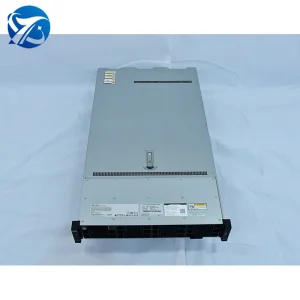
In the era of hyper-scale computational infrastructure and distributed AI clusters, hardware telemetry solutions have evolved from auxiliary monitoring protocols into critical operations-enabling assets. As enterprises rush to deploy dense GPU computational fabrics for Large Language Models (LLMs) and massive machine learning applications, the thermal, mechanical, and electrical stability of compute modules becomes paramount. Telemetry is the systematic process of gathering diagnostic data streams—such as transient voltage, GPU junction temperatures, fan rotational velocities, packet drop rates, and PCIe link integrity—from remote, deep-level hardware layers and conveying them to centralized management planes.
Globally, the market for telemetry solutions is experiencing an unprecedented surge, driven by two key forces: the expansion of green data centers and the critical requirement of AI models for predictive hardware failure prevention. Without sub-millisecond precision telemetry, a transient memory bus error or an instantaneous power spike could compromise training runs costing millions of dollars. Consequently, standard Out-of-Band (OOB) Baseboard Management Controllers (BMCs) are being re-engineered by manufacturers to output high-frequency streaming telemetry via protocols such as gRPC, Apache Kafka agents, and Redfish Eventing API models.
Traditional polling methods (e.g., legacy SNMP requests every 5 minutes) are insufficient for modern workloads. Modern telemetry engines stream core metrics continuously at millisecond resolution to capture thermal throttling episodes.
Critical failures often disable the host OS. Modern systems isolate telemetry channels through specialized management networks (OOB via BMC controllers), ensuring continuous visibility even during a full crash.
Proprietary protocols are yielding to unified JSON-based Redfish schemas. This enables cross-vendor interoperability across hybrid platforms, including Dell, HPE, and custom-designed ODM nodes.
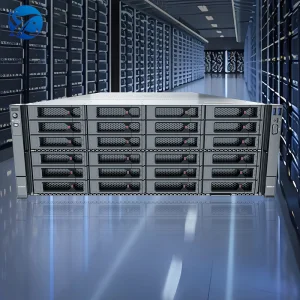
The integration of telemetry solutions is transitioning through an active paradigm shift. Over the next five years, telemetry architectures will evolve from reactive monitoring models to predictive and self-healing systems. As hardware platforms grow denser, micro-level anomalies present complex failure modes that manual administration cannot address in real time.
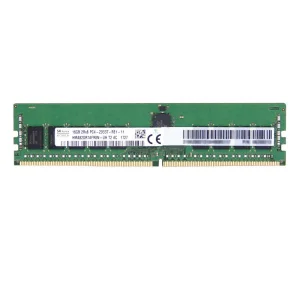
Key focus areas within the technical roadmap include the standardization of SmartNIC telemetry, where network interfaces gather transit information at the packet level, and PCIe Gen 6 / CXL link metrics monitoring. With Compute Express Link (CXL) sharing memory spaces between CPU and external accelerators, tracking memory coherence telemetry becomes crucial. This enables data center operators to predict degradation in memory pools before parity errors cause runtime kernel panics.
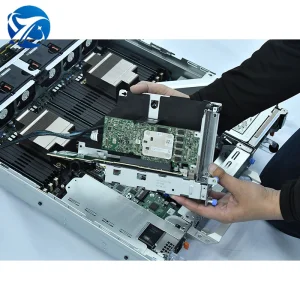
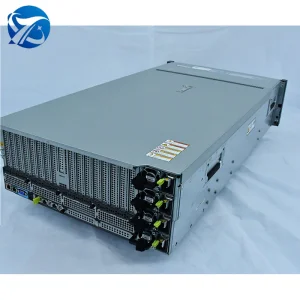
Integrating hardware-level sensor telemetry arrays with high-performance GPU and deep learning nodes to secure system stability under intensive workloads.
Founded in 2017, Nexora Intelligent Technology Co., Ltd. (Brand: NexoraGPU) is a specialized manufacturer of high-performance GPU servers, AI computing systems, HPC clusters, and telemetry-monitored enterprise storage solutions. Operationally, NexoraGPU bridges the gap between raw compute power and remote manageability by designing telemetry routing protocols into its custom server mainboards and chassis layouts.
Supported by 9 years of industry experience and 6 years of export history, NexoraGPU serves clients globally across North America, Europe, Southeast Asia, the Middle East, and South America, maintaining an annual export value exceeding US$18 million. Through specialized integration, their server platforms route real-time telemetry diagnostics directly to orchestration tools like Prometheus and Grafana dashboards.
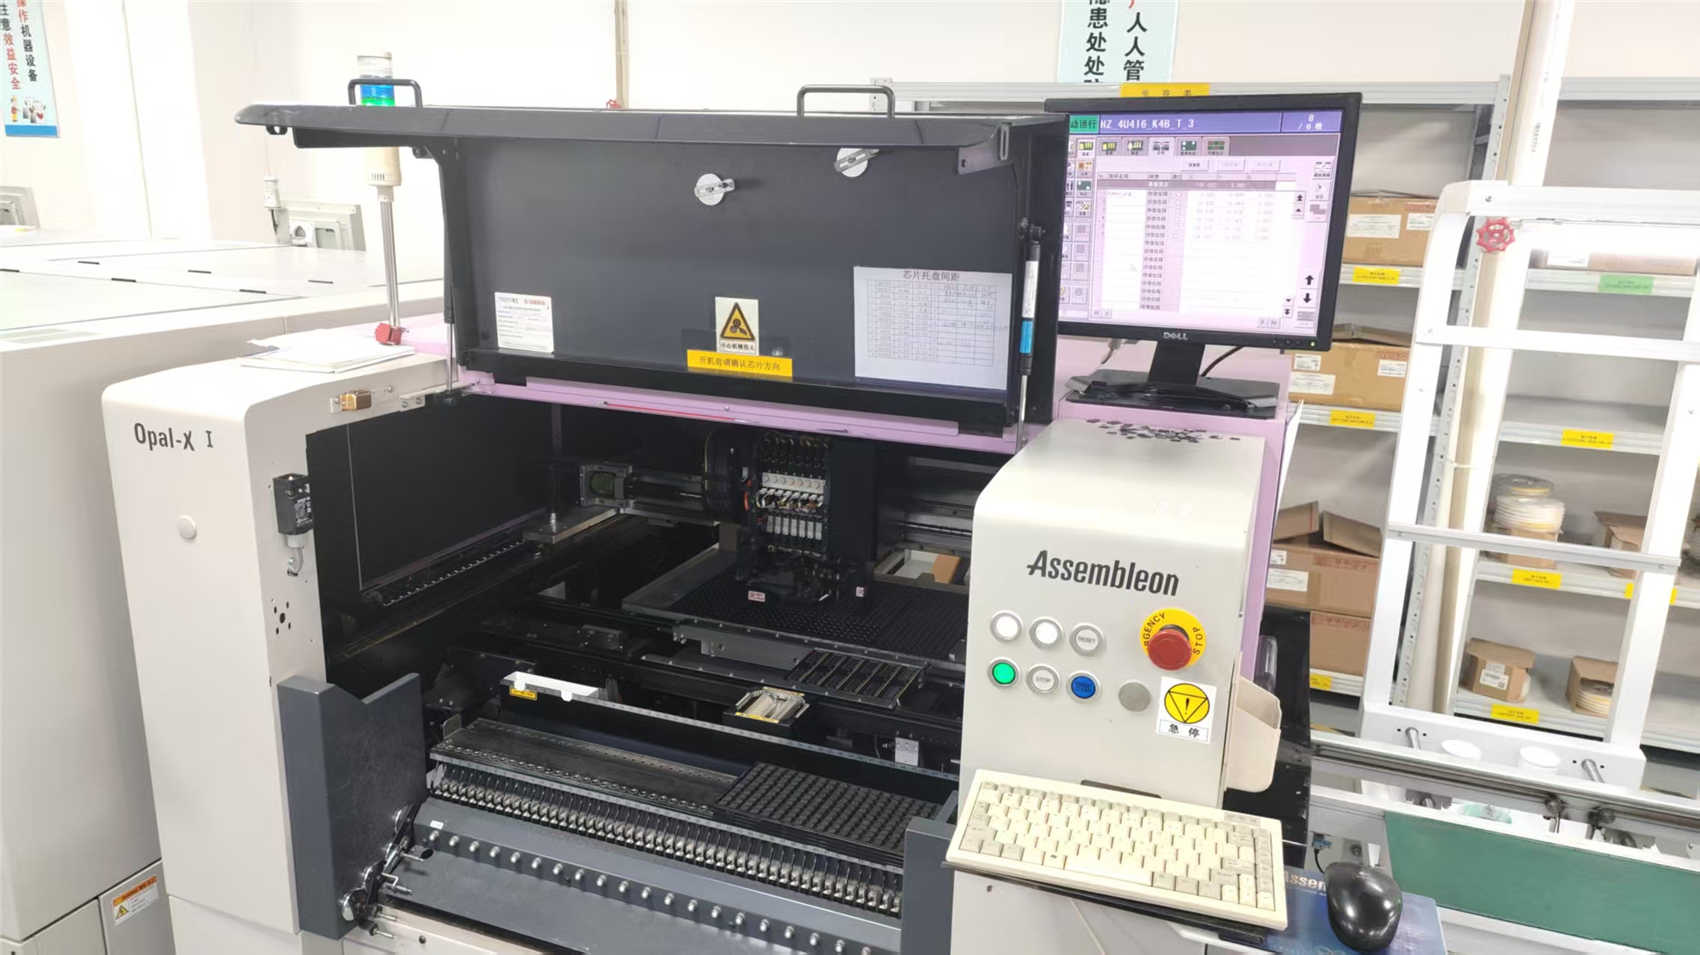
NexoraGPU maintains an engineering-first culture with an in-house R&D department consisting of 128 experienced engineers. They offer customized layout integration, helping users implement bespoke telemetry architectures—including thermal zone modifications, customized BMC firmware, liquid-cooling sensor loops, and custom-tailored Redfish JSON telemetry endpoints.
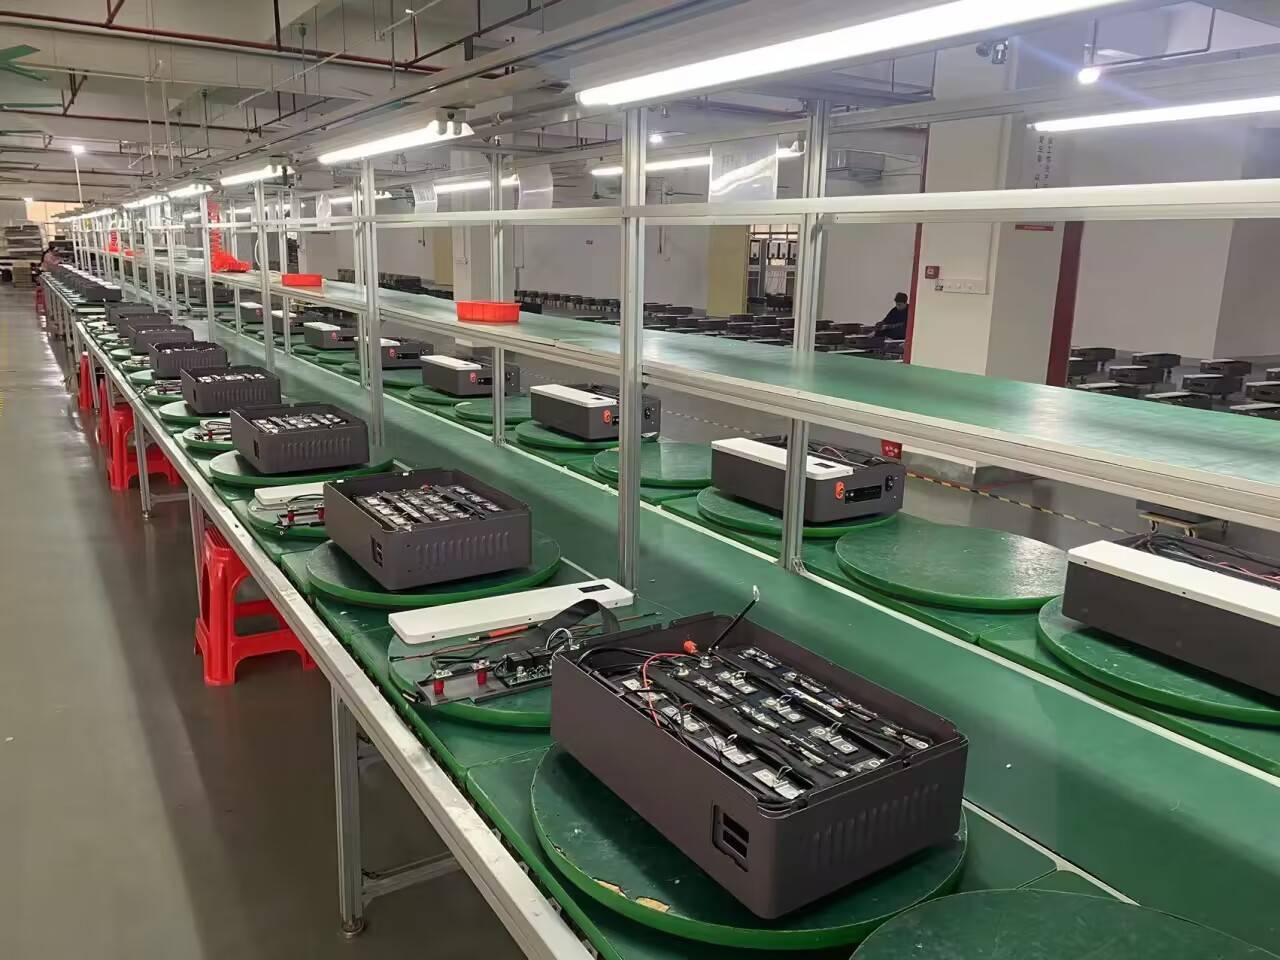

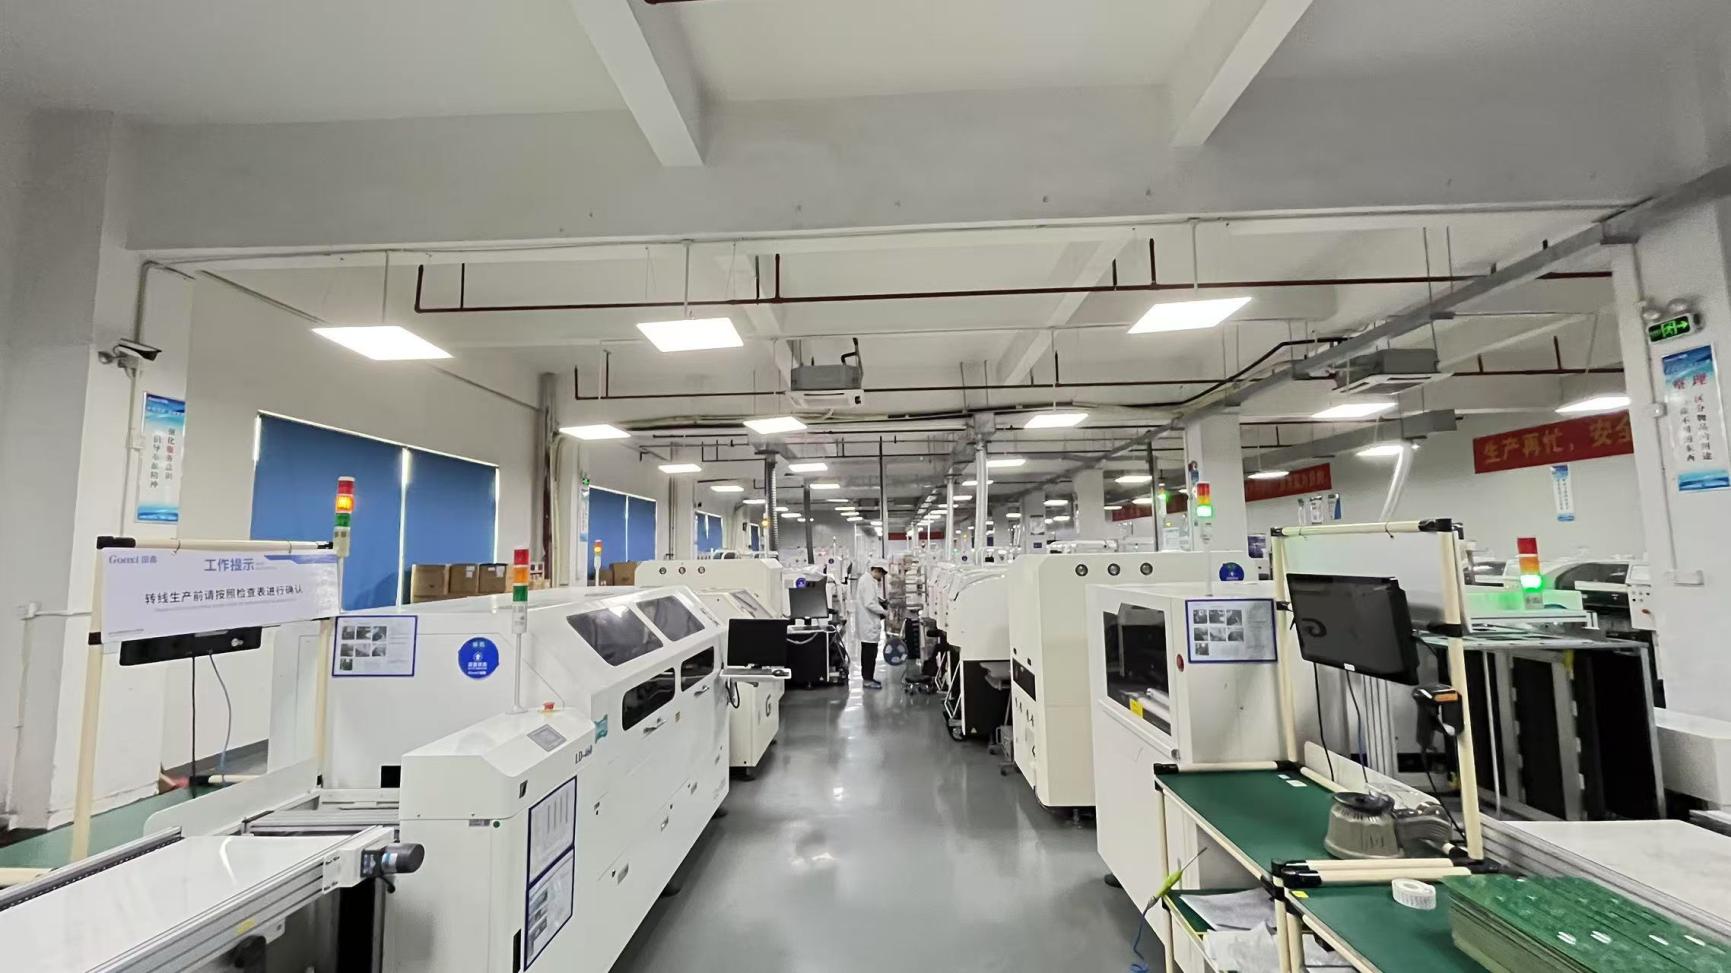
Operating from a modern production facility, NexoraGPU runs comprehensive testing protocols to ensure system reliability. Every GPU server undergo functional checks, prolonged high-temperature burn-in tests, and telemetry calibration to verify sensor feedback loops (such as fan curve transitions, core junction safety cutoffs, and power rail throttling) under maximum power load conditions.
An evaluation of the key players integrating high-resolution telemetry, out-of-band monitoring, and diagnostics into modern computing platforms.
Specializes in tailoring customized GPU server structures with integrated hardware sensors. Offers deep optimization of BMC channels, custom firmware for fan control based on telemetry endpoints, and custom server racks equipped with inline telemetry monitoring.
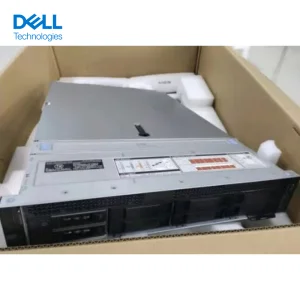
Dell’s iDRAC9 telemetry stream delivers high-speed, comprehensive hardware diagnostics without an operating system agent. The system streams data directly from CPU registers and memory systems to external analysis consoles.
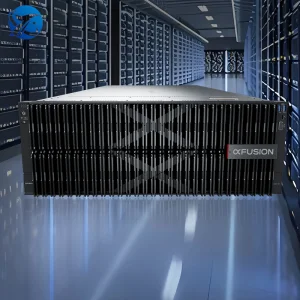
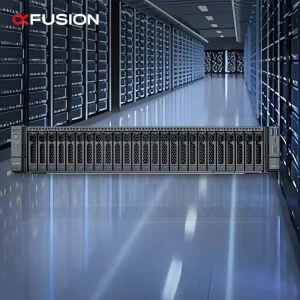
xFusion integrates intelligent diagnostic engines directly into their hardware. Their systems monitor power efficiency and manage fan curves dynamically to optimize cooling inside high-density multi-socket servers.
HPE servers utilize integrated Lights-Out (iLO) management ASIC technologies to collect and export system-level metrics. Data is fed directly into HPE InfoSight, an AI-driven management tool that predicts component failures.
Supermicro offers robust software-defined telemetry APIs on their systems. Their platforms enable operators to manage power usage, monitor thermal metrics, and control system assets across large deployments.
Lenovo’s XClarity hardware platform delivers direct telemetry streaming capabilities. It monitors resource utilization and environmental changes across clusters, allowing administrators to implement dynamic power limits.
Cisco integrates compute and networking telemetry into a unified dashboard. The Intersight platform offers visibility into network latency, data packet flow, and physical node status.
Inspur’s platforms are built to support dense cloud deployments. The ISMC platform monitors system health, alerts operators to thermal events, and provides power telemetry tools to manage server room efficiency.
Intel provides motherboard-level power and thermal monitoring tools. Their Node Manager software exposes interfaces that allow administrators to track chip-level telemetry and optimize energy use under load.
NVIDIA’s software stack provides deep diagnostics for GPU computing clusters. It tracks core health, memory utilization, and physical parameters to maintain performance in demanding AI environments.
Telemetry architectures must adapt to their deployment environments. A telemetry solution for an automotive assembly line operates under different parameters than one built for a deep-sea oil exploration rig or a sub-zero hyperscale data center.
In remote installations, network bandwidth can be limited. Here, telemetry systems rely on edge intelligence to process diagnostics locally. The system only transmits prioritized anomaly reports, saving bandwidth while ensuring system safety.
Modern AI server farms run close to their thermal limits. In these systems, telemetry loops connect temperature sensors directly to the facility's cooling units. If a specific rack reports a thermal spike, local fan speeds adjust automatically to prevent hardware throttling.
In manufacturing plants, telemetry controllers track the physical conditions of assembly hardware. Monitoring mechanical vibration, supply currents, and operational timing helps systems predict when components are nearing failure, reducing unplanned downtime.
Frequently asked questions concerning hardware telemetry integration, modern APIs, and system diagnostics.
Traditional systems pull data by sending periodic requests (e.g., via SNMP) to the device. This creates processor overhead and can miss short-term anomalies. Push telemetry reverses this model; the managed system streams data continuously to the receiver. This approach lowers overhead and provides the high-frequency reporting needed to track rapid changes in GPU power or processor activity.
AI workloads can place sudden, intense loads on power and cooling systems. Telemetry solutions monitor physical parameters—such as core voltage, transient currents, and memory errors—in real time. The management plane uses this data to adjust cooling policies or balance workloads, helping prevent hardware issues and maintaining overall cluster stability.
Legacy tools often relied on complex, non-standard schemas. Redfish provides a modern API interface using JSON payloads over standard HTTPS connections. This makes it easier for developers to integrate telemetry data from different hardware vendors into a single, unified management tool.
Yes. Out-of-band telemetry runs on the hardware's Baseboard Management Controller (BMC). Because the BMC operates independently of the main CPU, it can collect and transmit system diagnostics even if the host operating system crashes or fails to boot.
High-density computing arrays featuring integrated Out-Of-Band (OOB) hardware telemetry controllers, real-time power capping interfaces, and enterprise IPMI 2.0 / Redfish specifications.